Key Contract Management KPIs to Track
The most useful contract management KPIs track speed, compliance, risk, and realized value across the contract lifecycle, so teams can reduce cycle delays, prevent missed obligations, and protect financial outcomes. Start with cycle time, approval time, renewal rate, compliance rate, and value leakage, then layer in deeper operational metrics as data quality improves.
Key Takeaways
- Poor contract management can cost organizations around 8.6% of annual revenue through lost value, missed obligations, and fragmented processes.
- The most useful contract management KPIs cover speed, compliance, risk, and value realization to improve operations and business outcomes.
- Teams that standardize workflows, automate approvals, and improve visibility can reduce cycle time, improve compliance, and prevent value leakage.
- A modern platform like CAMARC makes contract analytics and reporting easier by centralizing requests, approvals, execution, and obligation visibility.
Contracts do more than document legal terms. They shape revenue, purchasing, supplier commitments, compliance obligations, and long-term business relationships. Yet many organizations still manage contracts through disconnected emails, spreadsheets, and manual follow-ups. That approach creates delays, weakens accountability, and makes it hard to know whether agreements are delivering the value they were designed to create.
This is why contract management KPIs matter. Tracking the right metrics helps teams move from reactive administration to proactive performance management, so they can identify delays, stalled approvals, upcoming renewals, missed obligations, and post-signature value loss.
Research highlighted by World Commerce and Contracting shows inefficient contracting can erode business performance, while contract data is often spread across many systems, limiting visibility and slowing decision-making. Contract management is no longer just an operational concern, it is a business performance issue.
When legal, procurement, finance, sales, and operations work from the same contract data, they can shorten cycle time and approval time, improve renewal rates, strengthen compliance, and reduce value leakage. CAMARC supports this with unified requests, approvals, execution, tracking, dashboards, and governance.
What Are Contract Management KPIs?
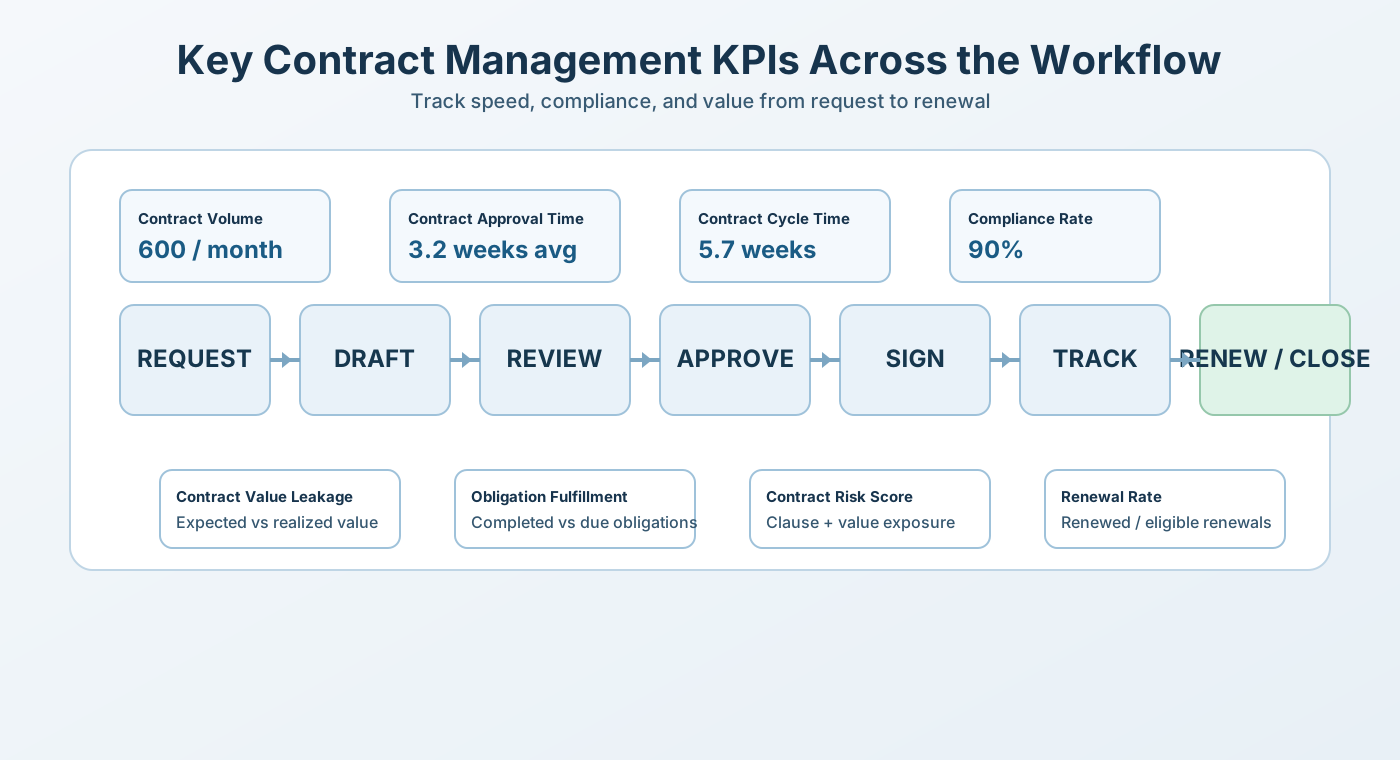
Contract management KPIs are measurable indicators used to evaluate how effectively an organization manages contracts across the full lifecycle: request, drafting, approval, execution, compliance, renewal, and post-signature performance. These contract performance indicators measure speed, quality, risk, and value in contract operations.
The strongest KPI programs typically cover four areas:
- Efficiency metrics such as contract cycle time and contract approval time—how fast contracts move through your system
- Compliance and risk metrics such as contract compliance rate and risk scoring—how well contracts adhere to policy and legal requirements
- Value metrics such as renewal rate, cost savings, and value leakage—whether contracts deliver expected financial outcomes
- Visibility metrics such as dashboard usage, reporting coverage, and obligation tracking—whether teams have access to actionable contract data
Without these measures, teams often rely on assumptions. With KPIs in place, contract management becomes measurable, comparable, and easier to improve across functions. Organizations tracking these metrics report cycle time reductions of 20-40%, compliance improvements of 15-25%, and value capture improvements of 3-8% of total contract value.
Why KPIs Matter More Than Ever
Contract management has evolved from a legal back-office function to a business-critical operation. Research from the Contracting Excellence Institute shows that organizations with mature contract management practices achieve:
- 30% faster cycle times from contract request to signature
- 25% reduction in compliance violations and audit findings
- 20% improvement in renewal capture rates
- 5-8% recovery of value leakage through better obligation tracking
The stakes are high: poor contract management costs organizations 5-9% of annual revenue through lost opportunities, missed obligations, penalties, and manual rework. By contrast, KPI-driven operations create early visibility into bottlenecks, risk, and value gaps—enabling teams to act before problems become costly.
Section references: Microsoft Adoption Guide, CAMARC
Top 10 Contract Management KPIs to Track
| KPI | What it measures | Why it matters | How to measure |
|---|---|---|---|
| Contract Cycle Time | Time from request to signature | Shows workflow speed and bottlenecks | Average days from initiation to execution |
| Contract Approval Time | Internal review and approval duration | Reduces delays and improves responsiveness | Average days from submission to final approval |
| Contract Renewal Rate | Percentage renewed on time | Protects revenue and supplier continuity | Renewed contracts divided by eligible renewals |
| Contract Compliance Rate | Percentage fully compliant | Reduces legal, audit, and operational risk | Compliant contracts divided by total contracts |
| Contract Value Leakage | Lost value after signing | Reveals revenue erosion and missed entitlements | Expected value vs realized value |
| Obligation Fulfillment Rate | Obligations completed on time | Tracks execution quality and accountability | Completed obligations divided by due obligations |
| Contract Risk Score | Risk level by contract or portfolio | Prioritizes risk mitigation and oversight | Score by clause, value, exposure, and deviations |
| Amendment Frequency | How often contracts change post-signature | Signals unclear scope or weak drafting | Amendments per contract or contract type |
| Contract Volume by Period | Created, active, or completed contracts | Supports resource planning and workload balancing | Weekly, monthly, or quarterly totals |
| Dashboard and Reporting Adoption | Use of analytics and reports | Confirms teams are using the data | Report usage, active users, KPI review cadence |
Detailed KPI Breakdown
1. Contract Cycle Time (Days from Request to Signature)
This is the most widely tracked KPI because it directly impacts business speed. It measures total calendar days from the moment a contract request is created through final signature and delivery.
How to measure: Calculate the average number of days between contract initiation date and execution date. Segment by contract type (vendor agreements, sales contracts, service agreements, NDA, MSA) and by approver/business unit to identify where delays occur.
Benchmark targets: Simple contracts (NDAs, purchase orders) often complete in 3-7 days. Standard commercial contracts (vendor agreements, client proposals) typically take 10-20 days. Complex contracts (partnerships, enterprise software deals, construction contracts) may take 30-60+ days. World Commerce & Contracting research shows leaders achieve 25-30% cycle time reductions through standardization and workflow automation.
Common causes of slow cycle times: Unclear approval chains, missing templates, excessive redlining, unclear contract requirements, slow stakeholder feedback, manual review steps, and lack of e-signature integration.
2. Contract Approval Time (Internal Review Duration)
Approval time measures how long contracts spend in review and approval queues—a key subset of total cycle time. This KPI reveals bottlenecks in your review process and helps teams identify which approvers or teams slow down progress.
How to measure: Track days from contract submission for review through all required approvals. Measure both total approval time and approval time per reviewer role (legal, finance, procurement, business owner). Calculate average and percentile metrics (50th, 75th, 95th percentile approval times).
Benchmark targets: High-performing organizations target 1-3 days for routine approvals and 5-10 days for complex reviews. If approval takes longer than 10-15 days, look for process bottlenecks, unclear approval criteria, or over-centralized decision-making.
Industry variations: Financial services and healthcare often have longer approval times due to regulatory requirements (10-20 days average). Manufacturing and tech typically move faster (3-7 days). Real estate varies widely depending on property value and deal complexity.
3. Contract Renewal Rate (Percentage Renewed On Time)
Renewal rate measures the percentage of eligible contracts that are renewed or renegotiated before expiration. Missed renewals create business continuity risk and often force unfavorable emergency renegotiations.
How to measure: Divide renewed contracts by total contracts eligible for renewal in a given period. Track renewals by contract type, business unit, and vendor category. Also measure "renewal capture rate"—the value of renewed contracts divided by at-risk revenue.
Benchmark targets: Most organizations should aim for 85-95%+ renewal rates. Below 80% typically indicates weak renewal workflows, missed expiration alerts, or broken vendor relationships. Leading organizations with automated renewal management achieve 92-98% renewal rates.
Impact of low renewal rates: Expired contracts create legal ambiguity (is the old contract still in force?), service continuity risk (vendor can stop service), unfavorable renegiation leverage (vendors know you need renewal urgently), and compliance gaps if renewal requires updated terms (insurance, certifications, etc.).
4. Contract Compliance Rate (Percentage Compliant)
Compliance rate measures what percentage of your active contracts are in full compliance with their terms, obligations, and any governing policies or regulations.
How to measure: Define compliance criteria (e.g., all obligations tracked, required payments made on time, necessary certifications current, required reporting submitted, insurance requirements met). Audit a representative sample of contracts quarterly or audit 100% of high-value contracts monthly. Compliance = (Compliant contracts / Total contracts reviewed) × 100.
Benchmark targets: Leading organizations maintain 90-98% compliance rates. Rates below 85% indicate either weak obligation tracking, inadequate vendor oversight, or unclear internal accountability for compliance.
Common compliance gaps: Late payments to vendors, missed insurance certificate renewals, overdue compliance certifications, obligations not tracked or assigned to owners, auto-renewal terms not updated, regulatory changes not incorporated, and missing documentation of contract approval.
5. Contract Value Leakage (Lost Value After Signature)
Value leakage is the gap between contract value as signed and the value actually realized. For a $100K contract, if $8K in entitlements are never claimed or $5K is lost to non-compliance, leakage is $13K or 13%.
How to measure: For vendor contracts, calculate (Expected spend - Actual spend + unused discounts). For sales contracts, calculate (Expected revenue - Actual revenue + unclaimed upsells). For service contracts, calculate (Expected SLA credits/rebates - Actual claimed credits/rebates). Aggregate to portfolio level.
Benchmark targets: Unmanaged portfolios typically lose 3-9% of contract value. Well-managed portfolios keep leakage below 1-2%. Organizations with best-in-class obligation tracking and incentive management achieve near-zero leakage.
Sources of leakage: Unused volume discounts or rebate programs, missed SLA credits or performance incentives, unexercised upsells or cross-sells, non-compliance penalties, missed early payment discounts, unused warranties or service credits, and forgotten contract addenda or amendments.
6. Obligation Fulfillment Rate (On-Time Obligation Completion)
This KPI tracks what percentage of contract obligations (deliverables, milestones, payments, reports, certifications) are completed by their due dates.
How to measure: For each contract, identify all obligations with specific due dates. Track completion status and timeliness. Fulfillment rate = (Obligations completed on time / Total obligations due in period) × 100.
Benchmark targets: Aim for 90-98% fulfillment rate. Below 85% indicates weak obligation assignment, poor tracking, or accountability gaps. High fulfillment rates correlate strongly with vendor satisfaction and contract renewals.
Best practice: Automate obligation reminders 30, 14, and 7 days before due date. Assign each obligation to a specific owner. Track completion in your CLM system for visibility across teams.
7. Contract Risk Score (Risk Assessment by Contract)
Risk scoring assigns a numerical score to each contract reflecting its risk level based on financial exposure, unfavorable terms, compliance complexity, vendor reliability, or regulatory sensitivity.
How to measure: Create a risk matrix scoring 5-10 factors: contract value (high value = higher risk), renewal status (near expiration = higher risk), compliance complexity, unfavorable terms (one-sided clauses, aggressive termination rights), vendor track record, regulatory requirements (HIPAA, SOX, export controls), and amendment frequency (frequent changes = unclear terms = higher risk). Score each factor 1-5, then aggregate to total contract risk score.
Benchmark targets: Use risk scores to segment contracts into Red (high risk, requires executive review), Yellow (medium risk, requires regular monitoring), and Green (low risk, routine management). Most portfolios should target 70-80% Green contracts, 15-25% Yellow, and <5% Red contracts.
Risk mitigation action: High-risk contracts should receive structured oversight: quarterly business reviews, executive sponsor tracking, proactive renewal planning, and enhanced compliance monitoring.
8. Amendment Frequency (Post-Signature Changes)
Amendment frequency measures how often contracts require changes after signature. High amendment rates signal unclear initial scope, weak drafting, or misaligned expectations.
How to measure: Track number of amendments per contract. Calculate median and average amendments per contract type. Express as amendments per 100 contracts or amendments per $1M contract value.
Benchmark targets: Simple contracts (NDAs, standard POs) should average 0-1 amendment. Standard commercial contracts (vendor agreements, service agreements) should average 1-2 amendments. Complex contracts (partnerships, software deals) may see 2-4 amendments as normal. If amendment frequency exceeds benchmarks for your contract type, investigate root causes.
Why it matters: High amendments indicate: (1) unclear initial requirements or scope creep, (2) weak contract drafting or unbalanced terms, (3) changing business needs mid-contract, or (4) lack of vendor accountability for original terms. Reducing amendments improves cycle time, reduces legal overhead, and strengthens contract performance.
9. Contract Volume by Period (Workload Tracking)
Volume metrics track how many contracts are created, active, completed, or expiring in a given period. This supports resource planning, capacity management, and process improvement.
How to measure: Count contracts created, signed, renewed, expired, and terminated by week, month, or quarter. Track by contract type, business unit, or team. Monitor trends over time.
Why it matters: Volume trends help you: (1) plan staffing and legal resource allocation, (2) identify seasonal patterns (e.g., fiscal year-end contracting surges), (3) set realistic targets for other KPIs based on actual workload, and (4) detect process improvements that increase throughput.
Benchmark context: Volume varies widely by industry. Software companies and tech may execute 50-200+ contracts monthly. Manufacturing may process 20-50 monthly. Real estate may see 5-20 depending on portfolio size. Use your own historical trends as baseline.
10. Dashboard and Reporting Adoption (Visibility and Usage)
Adoption metrics measure whether teams actually use contract dashboards and analytics. High KPI quality is worthless if nobody looks at the data.
How to measure: Track monthly active users (MAU) of contract dashboards. Track report generation frequency (how often dashboards are viewed or reports are exported). Track KPI review meeting attendance and cadence (are quarterly reviews happening?). Express as percentage of eligible users or percentage of teams.
Benchmark targets: Aim for 60-80%+ active monthly usage among stakeholders. If usage is below 40%, investigate barriers: unclear how to access dashboards, insufficient training, irrelevant metrics, or lack of management expectation to review KPIs.
Adoption levers: Tie KPI reviews to decision-making (e.g., "We review renewal rate at quarterly business reviews to forecast vendor risk"). Embed dashboards in existing workflows. Provide user training. Create role-specific views for different stakeholders (CFO wants value leakage, procurement wants cycle time, legal wants compliance).
These metrics create clarity where manual contract management often creates confusion. If approvals take weeks and renewals stretch across months, organizations lose time, leverage, and sometimes money.
Want better visibility into contract performance? Use CAMARC to centralize approvals, obligations, execution, and dashboards so KPI tracking is embedded in daily operations.
Section references: Procurement Tactics contract statistics, Ironclad discussion on value leakage
How to Track and Improve These KPIs
Step 1: Centralize contract data
Move contracts out of fragmented systems and into one controlled environment. Centralization ensures each contract has clear metadata, ownership, milestones, approval history, and searchable content. This is foundational—you cannot measure what you cannot see.
Implementation approach: Migrate existing contracts into your CLM system with standardized metadata (contract type, value, parties, key dates, obligations, risk level). Use a phased approach: high-value contracts first (tier 1), then standard commercial contracts (tier 2), then remaining contracts (tier 3). Ensure each contract record captures: execution date, renewal date, approval dates, renewal status, compliance notes, and key obligations with due dates.
Step 2: Define KPI ownership
Every KPI should have an owner. Legal may own compliance and risk, procurement may own renewals, sales may own cycle times, and finance may own leakage and value realization. Ownership creates accountability and ensures someone is focused on improvement.
Recommended ownership model:
- Chief Legal Officer / General Counsel: Overall accountability for contract compliance rate and contract risk score
- Head of Procurement / Sourcing: Vendor contract renewal rate, amendment frequency, vendor performance obligations
- VP of Sales / Revenue: Sales contract cycle time, sales contract value realization, approval time for sales contracts
- Finance / Controller: Contract value leakage, payment obligation fulfillment rate, cost savings realization
- Operations / Contract Manager: Overall cycle time, dashboard adoption, reporting cadence, contract volume management
Step 3: Set targets and benchmarks
KPIs work best with explicit targets. If cycle time is currently 30 days, set a target of 20 days. If compliance is 82%, target 95%. Use both absolute targets (specific metrics) and improvement targets (reduce by 25% within 12 months).
How to set realistic targets:
- Measure current state for 3 months to establish baseline
- Benchmark against industry standards and peer organizations
- Identify top quartile (best-performing peers) as stretch target
- Set medium-term targets (6-12 months) at 50% of the way between current state and top quartile
- Set long-term targets (2-3 years) at top quartile or better
- Communicate targets with leadership, gain budget/resource alignment for improvement initiatives
Example target-setting for cycle time: If current state is 35 days, peers average 25 days, and top quartile is 15 days, your targets might be: 6-month target = 27 days (33% improvement), 12-month target = 22 days (37% improvement), 2-year target = 16 days (54% improvement toward best-in-class).
Step 4: Automate workflow and reminders
Manual contract management creates delays at every stage. Workflow automation reduces friction and creates accountability. Key automation opportunities:
- Approval routing: Contracts automatically route to appropriate approvers based on value, type, business unit, and contract terms
- Escalation rules: Stalled approvals automatically escalate to managers after 2-3 days
- Renewal reminders: Automated alerts 90, 60, 30 days before expiration to business owner and procurement
- Obligation reminders: Alerts to obligation owners 30, 14, and 7 days before due date
- Compliance checks: Automated validation that required elements (insurance, certifications, approval evidence) are present in contract record
- E-signature integration: Contracts automatically flow to signature provider (DocuSign, Adobe Sign, etc.) and signature date automatically captured in CLM system
- Post-execution: Signed contracts automatically filed, obligation list auto-populated from contract terms, renewal date auto-calculated
Step 5: Review KPI dashboards regularly
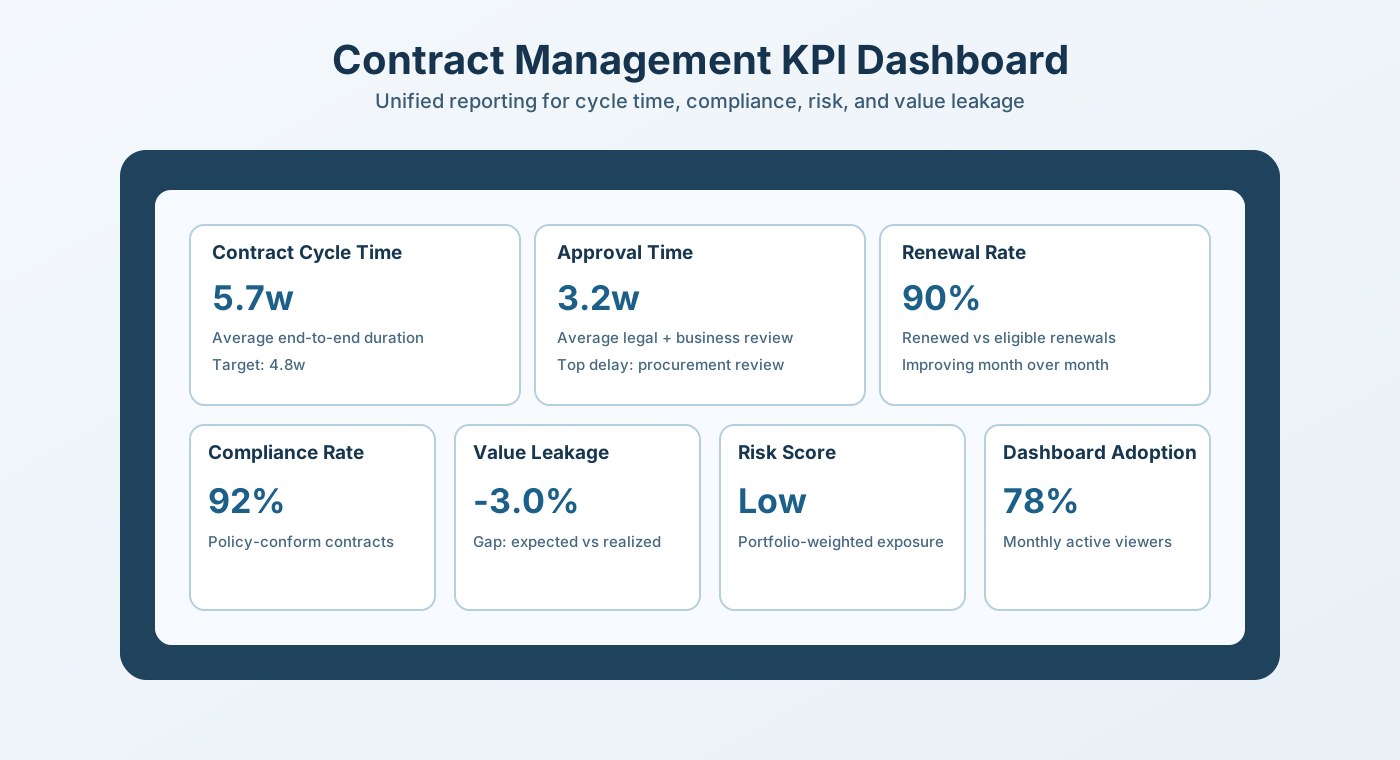
Run a monthly or quarterly contract management reporting rhythm. Review trends by contract type, team, or business unit and focus on exceptions. Create recurring review meetings with clear stakeholders and decision authority.
Recommended review cadence:
- Weekly operational: Contract Operations team reviews current volume, stalled approvals, overdue obligations (15 minutes, operational team only)
- Monthly department: Department head + contract manager reviews department-specific KPIs and improvement initiatives (30-45 minutes, by department)
- Quarterly executive: CFO/COO + GC + Procurement Head reviews portfolio-wide KPIs, approves improvement roadmap, reviews business impact (60 minutes, executive steering committee)
Sample quarterly dashboard should include: Cycle time trend (current, vs target, vs 12-month trend), approval time by reviewer role, renewal pipeline (at-risk contracts by renewal date), compliance rate by contract type and business unit, top contract risks (Red-rated contracts with action plans), value leakage by category, and obstacle/bottleneck summary with owner and target resolution date.
Step 6: Act on the data
Metrics create value only when they drive decisions and action. Establish a decision framework for when and how to act on KPI insights.
Sample action triggers and response:
- If approval time exceeds target by 20%+: Analyze which approvers are bottlenecks, simplify approval chains, provide training, or escalate to executives for priority handling
- If renewal rate is below 85%: Implement automated 90-day renewal alerts, assign renewal owners, improve contract owner engagement, review vendor relationship health
- If compliance rate is below 90%: Audit non-compliant contracts, create corrective action plans, strengthen obligation tracking and assignment, enforce ownership accountability
- If value leakage exceeds 3%: Implement post-signature value capture program, train commercial teams on contract entitlements, automate rebate/discount claim processes, establish vendor performance reviews
- If amendment frequency exceeds targets: Review original contract drafting quality, improve contract templates, implement change control process for scope creep, train stakeholders on contract terms
Practical starting point: begin with five KPIs: contract cycle time, approval time, renewal rate, compliance rate, and value leakage. Expand once your reporting cadence is stable and teams are consistently using data to drive decisions.
Section references: Microsoft Adoption Guide, CAMARC
Industry-Specific KPI Considerations
While the 10 core KPIs above apply across industries, different sectors place varying emphasis on specific metrics based on business model and risk profile.
Software and Technology (SaaS, Enterprise Software)
- Primary focus: Contract cycle time (critical for revenue), sales contract value realization (discounts, upsells), renewal/expansion rate (recurring revenue health)
- Secondary focus: Approval time (speed to revenue), amendment frequency (signals scope clarity), vendor contract compliance (critical vendor relationships)
- Typical benchmarks: 10-20 day cycle time, 85%+ renewal rate, <5% value leakage due to competitive retention discounts
- Unique risks: Aggressive procurement negotiations eroding margins, non-renewal surprises in large accounts, high amendment frequency for integration/customization contracts
Healthcare and Life Sciences
- Primary focus: Contract compliance rate (regulatory requirements critical), contract risk score (HIPAA, FDA, fraud/abuse compliance), approval time (especially for clinical trials and vendor relationships)
- Secondary focus: Obligation fulfillment rate (patient safety and compliance obligations), amendment frequency (regulatory changes force frequent updates)
- Typical benchmarks: 20-30 day cycle time, 95%+ compliance rate, <1% value leakage on compliance-sensitive contracts
- Unique risks: Regulatory audits and inspections increase compliance oversight requirements, payer-provider contracts have complex obligation hierarchies, research contracts require extensive approval due to institutional review boards (IRBs)
Manufacturing and Supply Chain
- Primary focus: Renewal rate (supply continuity), amendment frequency (change order management for complex procurement), vendor contract compliance (quality, delivery, payment terms)
- Secondary focus: Value leakage (cost savings tracking), contract cycle time (long lead times mean contracts need early starts), obligation fulfillment rate (milestone tracking)
- Typical benchmarks: 30-45 day cycle time (longer due to RFQ and negotiation), 90%+ renewal rate, 2-4 amendments per contract due to change orders and specification updates
- Unique risks: Long contract lead times, complex supply agreements with multiple dependencies, high amendment volume due to engineering changes and supply variability
Real Estate and Property Management
- Primary focus: Contract cycle time (especially for leases with time-sensitive opportunities), renewal rate (tenant and vendor renewal tracking), value leakage (rent increases, expense recoveries, option exercise value)
- Secondary focus: Obligation fulfillment rate (maintenance and repair obligations), compliance rate (property management regulations, tenant rights)
- Typical benchmarks: 20-40 day cycle time for commercial leases, 85-95% renewal rate (portfolios with high turnover may see lower rates), 3-8% value leakage from missed escalation clauses and unused option periods
- Unique risks: Portfolio-wide renewal management for multi-property companies, tenant churn impacts revenue planning, regulatory compliance varies by jurisdiction
Financial Services and Insurance
- Primary focus: Contract compliance rate (regulatory requirements very high), contract risk score (counterparty risk, regulatory exposure, liquidity requirements), amendment frequency (regulatory changes and market volatility)
- Secondary focus: Approval time (complex approval chains for compliance and risk), renewal rate (counterparty relationship continuity), obligation fulfillment rate (regulatory reporting obligations)
- Typical benchmarks: 25-40 day cycle time (long approval chains), 95%+ compliance rate (strict regulatory focus), very high amendment frequency (2-5+ amendments per contract due to market changes)
- Unique risks: Regulatory scrutiny and audit requirements, complex derivative and hedging contracts with evolving market risks, counterparty credit risk requires ongoing monitoring
Business Value of KPI-Driven Contract Management
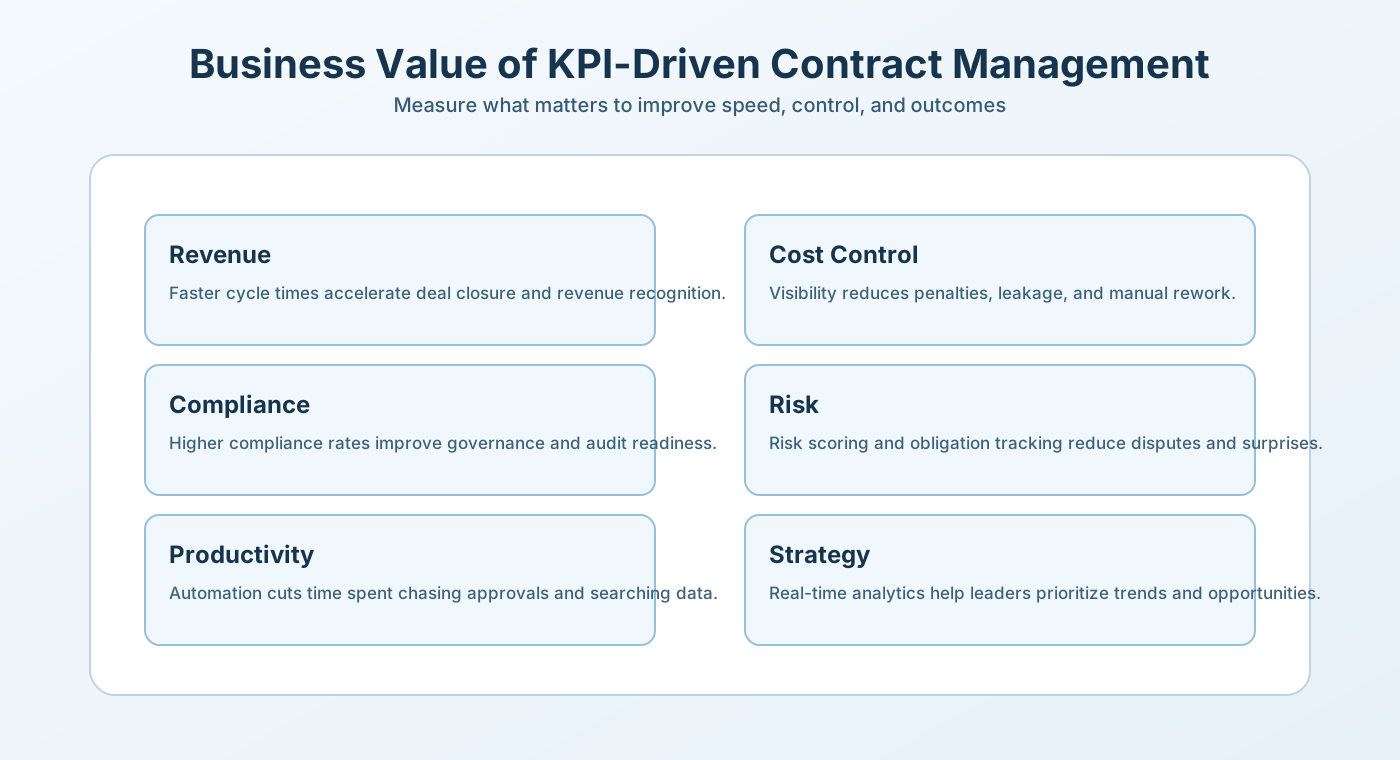
A strong KPI framework creates value beyond reporting. It improves decision-making, increases speed, reduces avoidable risk, and helps leadership treat contracts as strategic assets.
| Business area | Value delivered | Typical impact |
|---|---|---|
| Revenue | Faster cycle times support faster deal closure and revenue recognition | 20-40% cycle time reduction = 5-15% faster revenue booking in sales contracts |
| Cost control | Better visibility reduces leakage, penalties, and manual rework | 3-8% contract value recovery on vendor contracts, 30-50% reduction in duplicate or wasted spend |
| Compliance | Higher compliance rate supports governance and audit readiness | Reduced audit findings, fewer regulatory penalties, improved confidence in contracts |
| Risk | Risk scoring and obligation tracking reduce surprises and disputes | Fewer unexpected contract breaches, better prepared for audits, reduced legal disputes |
| Productivity | Dashboards and automation reduce time spent chasing approvals and searching for data | 20-30% time savings in contract lifecycle management through automation |
| Strategy | Real-time analytics help leaders spot trends, gaps, and opportunities | Data-driven negotiations, proactive vendor/customer relationship management, strategic sourcing insights |
Quantifying Business Impact
Here's how to calculate the financial benefit of KPI improvement for your organization:
- Revenue impact from faster cycle time: (Cycle time reduction in days ÷ Current cycle time days) × Number of contracts/year × Average contract value × Gross margin % = Revenue acceleration benefit
- Cost reduction from value leakage prevention: (Leakage % reduction) × Total contract value under management = Annual value capture
- Compliance cost avoidance: (Reduction in audit findings / compliance issues) × Average cost per finding = Risk mitigation value
- Operational efficiency: (Hours saved on manual contract work per contract) × Number of contracts × (Blended staff hourly rate) = Productivity savings
Example: A $500M technology company processes 200 contracts/year with $2.5M average value. If cycle time reduces from 25 days to 15 days (40% reduction), and gross margin is 70%, the revenue acceleration benefit is: (10÷25) × 200 × $2.5M × 70% = $14M in accelerated revenue that year. If value leakage reduces from 4% to 1% ($3.75M recovery annually) and operational efficiency saves 5 hours per contract × 200 = 1,000 hours, at $150/hour blended cost = $150K savings, the total first-year benefit exceeds $15M.
CAMARC centralizes requests, approvals, execution, obligation tracking, audit trails, and dashboards so teams can improve process maturity and business performance in one connected system.
Section references: WorldCC report summary, CAMARC
Best Practices for KPI Dashboards and Reporting
- Start with a small KPI set and expand after adoption stabilizes. Launch with 3-5 core KPIs (cycle time, approval time, renewal rate, compliance rate, value leakage). Add additional metrics quarterly once teams are comfortable with core KPIs and your data infrastructure is reliable.
- Use real-time visibility where possible for renewals, stalled approvals, and overdue obligations. Daily or weekly updates enable faster action. Delay in reporting creates delay in response. Automate data refresh rather than running manual reports.
- Segment reporting by contract type, business unit, or region. Different business units have different KPI drivers. Sales contracts may focus on cycle time and renewal rates. Vendor contracts may focus on compliance and amendment frequency. Create role-based views so each stakeholder sees the metrics most relevant to their function.
- Create recurring review cadence: monthly operational reviews and quarterly leadership reviews. Establish regular review meetings with clear decision authority. Without accountability for reviewing data, dashboards become decorative rather than operational.
- Use champions and role-based training to sustain usage. Designate power users and coaches for each department. Provide quarterly training on using the dashboard. Create simple one-page guides on "How to interpret Cycle Time," "When to escalate high-risk contracts," etc.
- Tie metrics directly to action plans and owners. When a metric drifts from target, create a specific action plan with owner, timeline, and success criteria. Review action plan progress at quarterly business reviews. Use "red-yellow-green" status indicators to show progress.
- Establish clear definitions and calculation methodology. Document exactly how each KPI is calculated, what data sources feed the calculation, what time periods are included, and what exclusions apply (e.g., do auto-renewed contracts count toward renewal rate?). Consistency in definition is critical for trending and comparing results over time.
- Benchmark against industry standards and peer organizations. External benchmarking helps leadership understand whether your results are competitive. Use industry surveys and peer networks to establish context for your metrics.
- Automate data collection and dashboard generation. Manual data gathering is error-prone and time-consuming. Use your CLM system as single source of truth. Automate dashboard builds to refresh nightly or weekly. Reduce the burden of reporting so teams focus on interpretation and action rather than data entry.
- Create a data quality governance process. Designate accountability for data accuracy. Conduct quarterly data audits to verify contract record completeness (all contracts have execution dates, approval dates, renewal dates, risk scores, and obligation lists). Clean data = trustworthy metrics.
Common Pitfalls to Avoid
- Vanity metrics: Tracking metrics that look good but don't drive decisions (e.g., total contract count means nothing without trend or context). Focus on actionable metrics linked to business outcomes.
- Inconsistent definitions: If cycle time is calculated differently by different departments, results won't be comparable and teams will distrust the data. Document definitions in writing and audit calculation consistency quarterly.
- Lack of data quality: Garbage in, garbage out. If contract records are incomplete, KPIs will be meaningless. Invest in data hygiene upfront: migrate contracts with complete metadata, enforce data entry standards, conduct quarterly audits.
- Dashboard overload: 50 metrics on a dashboard is paralyzing. Users need a few focused KPIs to understand status at a glance. Use dashboards for summary view and drill-down reports for detailed analysis.
- No accountability or action: Metrics create value only when they drive decisions. If KPI reviews happen but nothing changes, teams lose faith in the program. Establish clear ownership, escalation paths, and action plans for KPI gaps.
- Insufficient training: If users don't understand what a metric means or how to interpret it, adoption will be low. Invest in training and support. Create simple one-pagers and video tutorials explaining each KPI.
- Unrealistic targets: If targets are impossible to achieve, teams become demoralized. Set achievable targets that represent meaningful improvement. Use benchmarking and trend analysis to validate target feasibility.
- Ignoring external context: When a KPI drifts, investigate external factors (market changes, staffing, contract mix changes) before assuming poor execution. Adjust targets or celebrate improvements when external factors improve, just as you investigate when external factors worsen performance.
Technology and Tools for KPI Tracking
Modern CLM platforms provide built-in KPI dashboards and reporting. Key capabilities to look for:
- Real-time dashboards: Live status of key metrics updated daily or automatically. Ability to drill down from summary dashboard to individual contracts or approvers.
- Automated data collection: Dates, approval history, status changes captured automatically from contract records without manual entry. No separate reporting database required.
- Flexible segmentation: Ability to slice data by contract type, business unit, approver, approval time range, risk level, etc. to identify patterns and root causes of performance gaps.
- Integration with email and approval systems: Automatically capture approval dates, cycle time, and approval duration from integrated email or approval workflows. Reduces manual data entry and improves accuracy.
- Export and alerting: Export data to Excel, generate PDF reports, email alerts when KPI thresholds are breached (e.g., "15 contracts at risk for renewal in next 30 days").
- Historical trend analysis: View KPI trends over time (12-month moving average, month-over-month comparison, etc.) to identify improvement or deterioration patterns.
The goal is not a dashboard full of numbers. The goal is a system where contract analytics guide real operational and business decisions. Metrics should answer questions like: "Where are our biggest bottlenecks in contract approvals?" "Which vendors are at risk for non-renewal?" "How much contract value are we leaking to missed obligations?" "Are we improving cycle time, and if so, in which contracts or departments?"
Section references: Microsoft Adoption Guide, CAMARC
KPI Formula Library
To keep KPI discussions objective, define one approved formula for each metric and use it consistently across legal, procurement, finance, and operations. Small definition changes can completely alter trend interpretation, so formula governance is as important as the dashboard itself.
| KPI | Formula | Reporting note |
|---|---|---|
| Cycle Time | Average (Execution Date - Request Date) | Track average plus p50/p75/p90 to expose outliers |
| Approval Time | Average (Final Approval Date - Submission Date) | Segment by approver role and contract type |
| Renewal Rate | (On-time Renewals / Eligible Renewals) × 100 | Exclude intentionally terminated contracts |
| Compliance Rate | (Contracts Passing Compliance Checks / Contracts Reviewed) × 100 | Define pass/fail controls in policy first |
| Value Leakage | ((Expected Value - Realized Value) / Expected Value) × 100 | Use the same value model each quarter |
| Obligation Fulfillment | (Obligations Completed On Time / Obligations Due) × 100 | Assign every obligation to one owner |
| Amendment Frequency | Total Amendments / Active Contracts | Trend by contract family to find root causes |
| High-Risk Contract Ratio | (Red-Rated Contracts / Active Contracts) × 100 | Review with executive escalation list monthly |
Definition Governance Checklist
- Publish a one-page KPI dictionary that names each formula, source fields, and exclusions.
- Lock calculation logic for at least one quarter to preserve trend comparability.
- Version-control formula changes so leadership can see why a number moved.
- Audit source fields monthly to catch missing dates, owners, and obligation statuses.
90-Day KPI Rollout Roadmap
Teams often fail by launching too many metrics at once. A phased rollout gives stakeholders time to trust the data, adopt a review cadence, and tie metrics to decisions instead of treating dashboards as passive reports.
| Phase | Weeks | Primary objective | Deliverables |
|---|---|---|---|
| Foundation | 1-3 | Establish data quality and ownership | KPI dictionary, owner matrix, baseline extraction for top 5 KPIs |
| Pilot | 4-6 | Run a limited dashboard with one business unit | Role-based dashboard views, first monthly review, issue log |
| Scale | 7-10 | Expand to legal, procurement, sales, and finance | Cross-functional reporting cadence, SLA alerts, renewal watchlist |
| Operate | 11-13 | Move from reporting to action management | Executive QBR pack, remediation plans, next-quarter target plan |
What Good Looks Like by Day 90
- Every active contract has an owner, renewal date, and obligation status.
- Cycle time and approval time are segmented by contract type and reviewer lane.
- At-risk renewals are tracked with named owners and dated action plans.
- Compliance exceptions are mapped to corrective actions and re-check dates.
- Leadership receives one standardized KPI packet each quarter with trend commentary.
Escalation Triggers for Leadership Reviews
Set explicit thresholds so stakeholders know when operational variance becomes an executive issue. Example triggers include p90 cycle time rising for two consecutive months, renewal rate falling below target by five points, high-risk contract ratio above threshold, or leakage rising quarter-over-quarter.
FAQs
1. What are contract management KPIs?
They are measurable indicators used to evaluate how effectively contracts are created, approved, executed, tracked, and renewed.
2. Which contract KPIs should I start with first?
Start with contract cycle time, contract approval time, contract renewal rate, contract compliance rate, and contract value leakage.
3. How do I measure contract cycle time?
Measure the number of days between contract initiation and execution, then review the average by contract type or team.
4. Why is contract approval time important?
Slow approvals delay revenue, project starts, and vendor onboarding. Reducing approval time improves speed and responsiveness.
5. What is contract value leakage?
It is the gap between the value a contract should deliver and what it actually delivers because of missed obligations, pricing issues, weak monitoring, or process failures.
6. How can CAMARC help with KPI tracking?
CAMARC centralizes requests, approvals, execution, obligations, dashboards, and reporting, making contract performance easier to measure and improve.
7. How often should KPI reports be reviewed?
Monthly operational reviews and quarterly leadership reviews are a practical starting point for most organizations.
Suggested Internal Links
- Learn how CAMARC centralizes requests, approvals, execution, and tracking.
- Explore Contract Lifecycle Management to strengthen process maturity before KPI reporting.
- See how Contract Management Analysis Tools improve visibility across the lifecycle.